Since the beams are very flat because R=85.5 for JLC-1, a small
transverse rotation (![]() ) of the beam causes a significant
loss of luminosity. This effect is enhanced by the presence of the
crossing angle. Actually, the luminosities were estimated using ABEL
to be 0.93-, 0.80- and 0.55-times the nominal one for
) of the beam causes a significant
loss of luminosity. This effect is enhanced by the presence of the
crossing angle. Actually, the luminosities were estimated using ABEL
to be 0.93-, 0.80- and 0.55-times the nominal one for
![]() =
=![]() 0.005, 0.01 and 0.02 radian, respectively, where +
and - are for beam-1 and beam-2, respectively. Even for rotation
in the same direction, i.e. no relative rotation between two beams,
similar luminosity losses were obtained. On the other hand, in a
head-on collision the luminosity loss is only 20% at most, even for
0.005, 0.01 and 0.02 radian, respectively, where +
and - are for beam-1 and beam-2, respectively. Even for rotation
in the same direction, i.e. no relative rotation between two beams,
similar luminosity losses were obtained. On the other hand, in a
head-on collision the luminosity loss is only 20% at most, even for
![]() =
=![]() 0.02.
0.02.
First for the opposite rotation the right half of beam-1 with
![]() traverses above beam-2 with
traverses above beam-2 with ![]() during a
collision, while the left half traverses below beam-2. Therefore,
the azimuthal distribution from the right (left) half of beam-1 has
more (less) particles at
during a
collision, while the left half traverses below beam-2. Therefore,
the azimuthal distribution from the right (left) half of beam-1 has
more (less) particles at ![]() than at
than at ![]() . If two beams collide
head-on, no such up-down asymmetry is expected in the total
distribution, since the right- and left-hand sides cancel each
other. However, under the presence of a horizontal crossing angle
(see Fig. 2), particles on the right-hand side are
deflected more than those on the left. We therefore expect an
up-down asymmetry of
. If two beams collide
head-on, no such up-down asymmetry is expected in the total
distribution, since the right- and left-hand sides cancel each
other. However, under the presence of a horizontal crossing angle
(see Fig. 2), particles on the right-hand side are
deflected more than those on the left. We therefore expect an
up-down asymmetry of ![]() 1. The results of the simulation
agree with our expectation, as shown in Fig.10. The ratios
of
1. The results of the simulation
agree with our expectation, as shown in Fig.10. The ratios
of ![]() were obtained to be 0.99, 0.92 and 0.78 for
were obtained to be 0.99, 0.92 and 0.78 for
![]() =
= ![]() 0.005,
0.005, ![]() 0.01 and
0.01 and ![]() 0.02, respectively.
0.02, respectively.
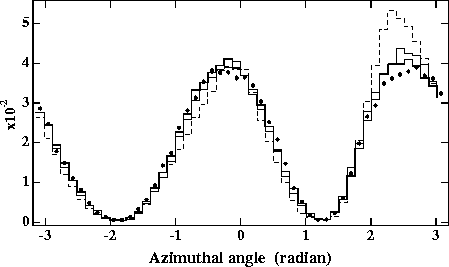
Figure 10:
Azimuthal angular distributions measured for 6< r < 7cm at z=+1m
for various transverse rotations compared with the nominal one(solid
circles). The signs of the rotations in xy plane are opposite for
two beams, i.e. ![]() =
= ![]() 0.005(solid line),
0.005(solid line), ![]() 0.01(dotted
one),
0.01(dotted
one), ![]() 0.02(dashed one) radian. The distributions are normalized
by the total number of particles.
0.02(dashed one) radian. The distributions are normalized
by the total number of particles.
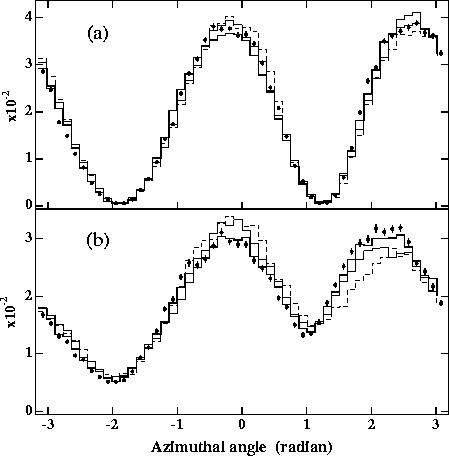
Figure 11:
Azimuthal angular distributions measured for (a) 6< r < 7cm and
(b) 5< r < 6cm at z=+1m for various rotations compared with the
nominal one(solid circles). The magnitudes of the rotations are
![]() =+ 0.005(solid line), +0.01(dotted one),
+0.02(dashed one) for both beams. The distributions are normalized
by the total number of particles.
=+ 0.005(solid line), +0.01(dotted one),
+0.02(dashed one) for both beams. The distributions are normalized
by the total number of particles.
Secondly, for the same rotation case, beam-1 traverses beam-2 from
its top(bottom) surface to its bottom(top) surface if the sign of the
rotation is positive(negative). We may expect an enhancement at the
down(up) side due to the crossing angle from the same arguments as in
the case of the opposite rotation. The simulation shows slight
enhancements in the distribution for 6< r < 7cm, as can be seen in
Fig.11(a), while the distribution for smaller radii,
5< r < 6cm, has clear up-down asymmetries for ![]() 0.01, as
shown in Fig.11(b). The reason for this radial
dependence can be explained based simply upon geometrical
considerations as follows. During a collision the vertical
displacement between the two beams is approximately a linear function
of
0.01, as
shown in Fig.11(b). The reason for this radial
dependence can be explained based simply upon geometrical
considerations as follows. During a collision the vertical
displacement between the two beams is approximately a linear function
of ![]() and
and ![]() (Fig.2) as well as
(Fig.2) as well as ![]() . The
particles measured for 6< r < 7cm are really created in the central
region of the collision,i.e. within about
. The
particles measured for 6< r < 7cm are really created in the central
region of the collision,i.e. within about ![]() in
in
![]() , where the vertical distance is very close to zero. The
particles measured at smaller radii should be created over a wider
region along
, where the vertical distance is very close to zero. The
particles measured at smaller radii should be created over a wider
region along ![]() with a significant amount of vertical
displacement. Thus, the sensitivity against
with a significant amount of vertical
displacement. Thus, the sensitivity against ![]() in up-down
asymmetries increases as r becomes smaller. However, there is a
certain limitation because of the poor monochromaticity of particles
energies at smaller r, as can be seen in Fig.5(a).
in up-down
asymmetries increases as r becomes smaller. However, there is a
certain limitation because of the poor monochromaticity of particles
energies at smaller r, as can be seen in Fig.5(a).
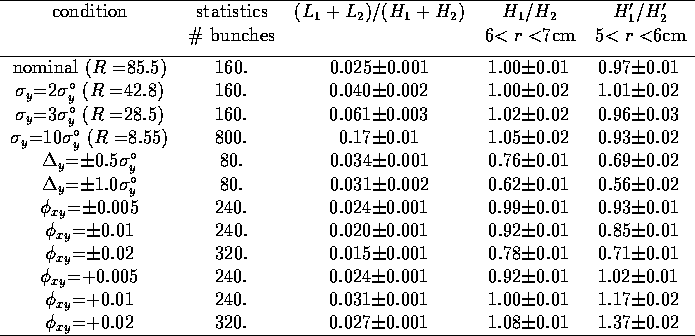
Table 1:
Summary of the results obtained by ABEL for JLC-I at
![]() =250GeV. The errors are only statistical, corresponding to
the number of bunch crossings listed in the second column. The
conditions in the first column show only changed beam parameters,
assuming that the others are the same as the nominal one.
These conditions are for both beams,
unless specified. The upper and lower signs in the first column
correspond to beam-1 and beam-2, respectively. In the last column,
=250GeV. The errors are only statistical, corresponding to
the number of bunch crossings listed in the second column. The
conditions in the first column show only changed beam parameters,
assuming that the others are the same as the nominal one.
These conditions are for both beams,
unless specified. The upper and lower signs in the first column
correspond to beam-1 and beam-2, respectively. In the last column,
![]() = -0.377
= -0.377![]() 0.251 and
0.251 and ![]() = 2.010
= 2.010![]() 2.638 according
to a movement of the second peak in the azimuthal angular
distributions for 5< r <6cm.
2.638 according
to a movement of the second peak in the azimuthal angular
distributions for 5< r <6cm.
Finally, we summarize all of the results in Tab.1.
Here, although we show the cases of particular signs of
displacements and rotations, the results for the opposite signs are
simply obtained by exchanging ![]() and
and ![]() . And although both
the vertical displacements and the transverse rotations produce
up-down asymmetries in
. And although both
the vertical displacements and the transverse rotations produce
up-down asymmetries in ![]() , the separation between them is
evident, as can be seen in Figs.9,10 and
11.
, the separation between them is
evident, as can be seen in Figs.9,10 and
11.