 What's New?
 Introduction
 Getting Started
 Top Subgroup Calendar
 Library

Japanese version of JLC Top Subgroup Home Page is here.
 What's New?
 Introduction
 Getting Started
 Top Subgroup Calendar
 Library
 What's New?
 Introduction
 There are various kinds of activities, both theoretical and experimental, in this group. Here, we only list a few of them.
The top quark with a mass in excess of 150 GeV has a very large decay width:
              m_t (GeV)   Gamma_t (GeV)
            -----------------------------
                100         0.09
                125         0.37
                150         0.81
                175         1.42
                200         2.23
            -----------------------------
which makes the top quark unique compared to the other quarks.
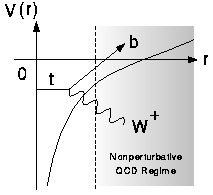
The top and the anti-top pair-created at
r=0 thus decay before entering the non-perturbative regime of QCD.
Because of this, the production cross section can be reliably
calculated with perturbative QCD, as first pointed out
by Fadin and Khoze.
We can thus carry out clean tests of perturbative QCD and
precision measurements of the strong coupling constant (alpha_s).
More importantly, since the QCD contribution is
unambiguously calculable,
other smaller effects such as the Higgs boson exchange contribution
may be extractable.
The leading QCD contribution comes from the multiple exchange of Coulombic gluons which is possible because the top and the anti-top are slow near threshold and stay close to each other.
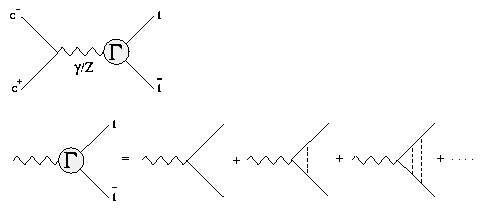
The threshold correction factor Gamma in the figure above satisfies the Bethe-Salpeter equation which reduces to Schroedinger's equation

in the nonrelativistic limit. The operator G is related to the threshold correction factor Gamma through

for the vector part corresponding to S-wave resonances and through

for the axial vector part corresponding to P-wave resonances.
Essentially all the t-tbar physics near threshold are contained in the threshold correction factor Gamma or G, which depends on the top momentum (P), the energy measured from the threshold (E), the strong coupling constant (alpha_s), the top width (Gamma_t), and, when the Higgs exchange contribution is sizable, the Higgs mass (m_H) and the normalized top Yukawa coupling (beta_H).
Now the question is how to measure G. We can measure the total cross section:

where n runs over resonances. We can see that the measurement of the total cross section is sensitive only to the absolute value of the coordinate-space wave function at the origin.
On the other hand, the differential cross section (top momentum distribution) directly reflects the shape of the momentum-space wave functions:
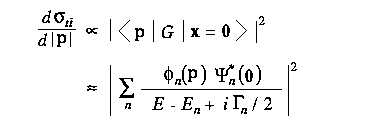
Notice that this is the first opportunity to measure the wave functions of quarkonia, since the lighter quarkonia decay via annihilation and the information on their constituent quark momenta is lost: the top momentum can be measured as the sum of the momenta of daughters (b-quark, and q qbar from W).
We first consider a threshold scan (total cross section measurements at multiple energy points near threshod). The left figure below is a Monte Carlo simulation of such an energy scan compared with the theoretical expectations for three diffent values of the strong coupling constant (alpha_s).
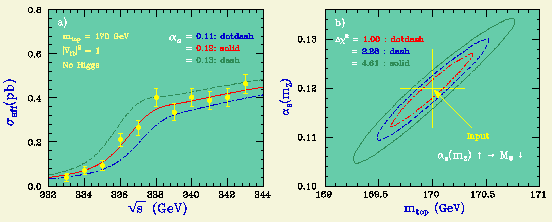
Notice that the larger the strong coupling constant becomes, the lower the shoulder (remnant 1S resonance) position moves and the higher the shoulder hight rises.
The right figure is the result of a chi-square fit to the cross sections letting m_t and alpha_s move freely. The strong correlation between m_t and alpha_s is due to the fact that the downward shift of the shoulder position due to a larger alpha_s can be compensated by making m_t larger. Nevertheless, we can expect a m_t resolution of about 0.35 GeV and an alpha_s resolution of 0.007 for m_t = 170 GeV, given 11 energy points of 1 inverse femtobarn each.
We can use the threshold scan data to determine the top width. When the top width becomes smaller, the shoulder which is a remnant of 1S peak rises higher, while the tail part below gets lower.
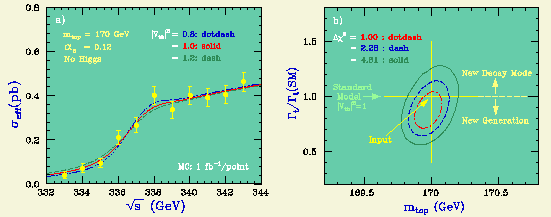
Using the same Monte Carlo data used above for the determination of m_t and alpha_s, and assuming that alpha_s is known from other sources, we can determine m_t and Gamma_t/Gamma_t(SM) through a chi-squared fit (see the right of the figure above). The expected statistical error on the top width in this method is 16% for 11 energy points with 1 inverse femtobarn each.
We can fit the same Monte Carlo data with the Higgs mass and the normalized Yukawa coupling squared. Then we get the figure below.
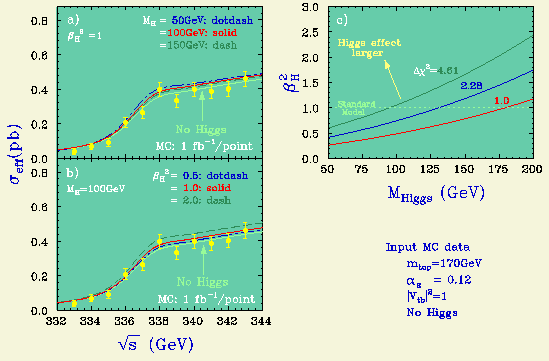
We can see that the normalized Yukawa coupling resolution here is about 25% for a standard-model Higgs of m_H = 100 GeV.
Before moving on to the differential cross section measurements, we tabulate below the expected statistical errors on various parameters for m_t = 150, and 170 GeV, when 11 energy points with 1 inverse femtobarn each are given.
            mt (GeV)                    150      170
          ----------------------------------------------
            delta m_t        (GeV)      0.20     0.35
            delta Gamma_t/Gamma_t       0.18     0.16
            delta alpha_s(mz)           0.005    0.007
            delta Yukawa(mh=100GeV)     0.43     0.25
          ----------------------------------------------
The error on m_t gets worse as m_t goes up since the 1S peak is now much
more difficult to see. The errors on the width and alpha_s
do not change much. The sensitivity to the Yukawa coupling
improves significantly.
As mentioned above, the differential cross section contains information independent of what is extractable from the total cross section. First we note that the shape of the top momentum distribution is insensitive to the Higgs exchange contribution corresponding to a short-range Yukawa potential that only modifies the overall normalization. This seemingly disappointing observation, however, implies at the same time that the top momentum distribution is free from the umbiguitiy due to the Higgs exchange contribution. It should also be emphasized that the top momentum distribution has essentially no dependence on the top mass, when we perform its measurements at an energy point measured from the 1S peak position. We can thus, in principle, disentangle the strong correlation between m_t and alpha_s in the case of the threshold scan.
We assume below that the top momentum measurement is carried out at 2 GeV above the 1S peak position. When alpha_s increases, the momentum peak position moves lower in contrast to our naive expectation from the virial theorem that the average momentum is proportional to m_t times alpha_s. This apparent contradiction comes from the fact that the 1S peak position gets lower as alpha_s increases (Jezabek, Kuhun, and Teubner). The measurement energy point thus moves lower with respect to the threshold and this downward shift of the energy overcompensates the upward momentum peak shift expected from the virial theorem.
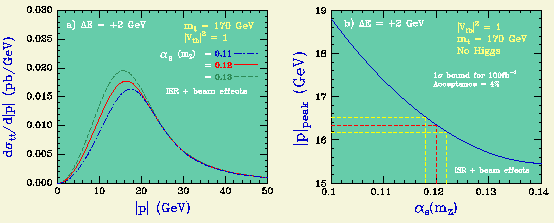
If the 1S peak position and the top width are known from other measurements, we can thus measure alpha_s with a statistical error of 0.0020 for m_t = 170 GeV, given 100 inverse femtobarns at 2 GeV above the 1S peak position.
On the other hand, when the 1S peak position and alpha_s are known from other measurements, we can use the momentum distribution to determine the top width. The momentum peak position shifts upward as the width gets larger. This is because the larger the top width, the deeper the potential at which the top decays.
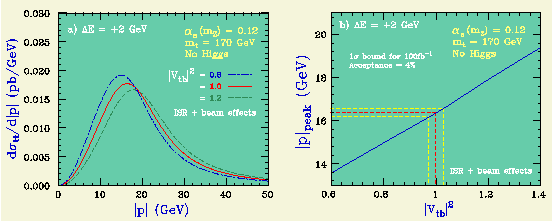
The expected statistical error on the top width is 3%, given 100 inverse femtobarns at 2 GeV above the 1S peak position.
As we did for the threshold scan, we tabulate the sensitivities to various parameters below.
                 mt (GeV)                    150      170
             ----------------------------------------------
               delta Gamma_t/Gamma_t       0.04     0.03
               delta alpha_s(mz)           0.0015   0.0020
             ----------------------------------------------
The m_t change does not make much difference. One should,
however, take into account the error on 1S peak position
which is not included here: the error on E_1S must be
worse than that of the m_t = 150 GeV case.
Anyway, the error on E_1S can be reduced by increasing
statistics. On the other hand, the other measurements
through threshold scan depend on the absolute values of
total cross sections which are more difficult to
determine experimentally and cannot be improved by
simply increasing statistics.
Once the E_1S is given, we only need to know the shape
of the momentum distribution whose experimental accuracy
will improve with statistics, which is the advantage of
the momentum measurement (its disadvantage is, of course,
that it requires high statistics).
There is yet another novel feature at the t-tbar threshold,
that is the possibility to measure the forward-backward asymmetry
(Murayama and Sumino).
The forward-backward asymmetry comes from the interference
between S- and P-wave resonances, which is possible only for
the toponia having a large width and decay via weak interactions.
For details of these measurements,
see PRD50(1994)4341 in Library.
 Getting Started
 Top Subgroup Calendar
 Library